Speed Is a Design Decision
A team booked to 95 percent of its capacity is not 19 percent busier than a team booked to 80 percent. It is nineteen times slower to start anything new. This piece is about where the calendar actually goes on a software project, why the answer is almost never typing speed, and what taste has to do with a delivery date.
Ask any agency how they deliver quickly and you will get an answer about people. Senior people, motivated people, people who care, people in the right time zone. It is a comforting answer because it means the only thing standing between you and a fast project is somebody's effort.
The real answer is duller and much more useful. Most of the time on a software project is not spent doing the work. It is spent waiting for the work to start. Speed is not something a team feels. It is something a system is designed to produce or to prevent, and the design is legible in advance if you know which numbers to look at.
The queue eats the calendar
Here is the single most useful piece of mathematics in delivery, and almost nobody in this industry can draw it.
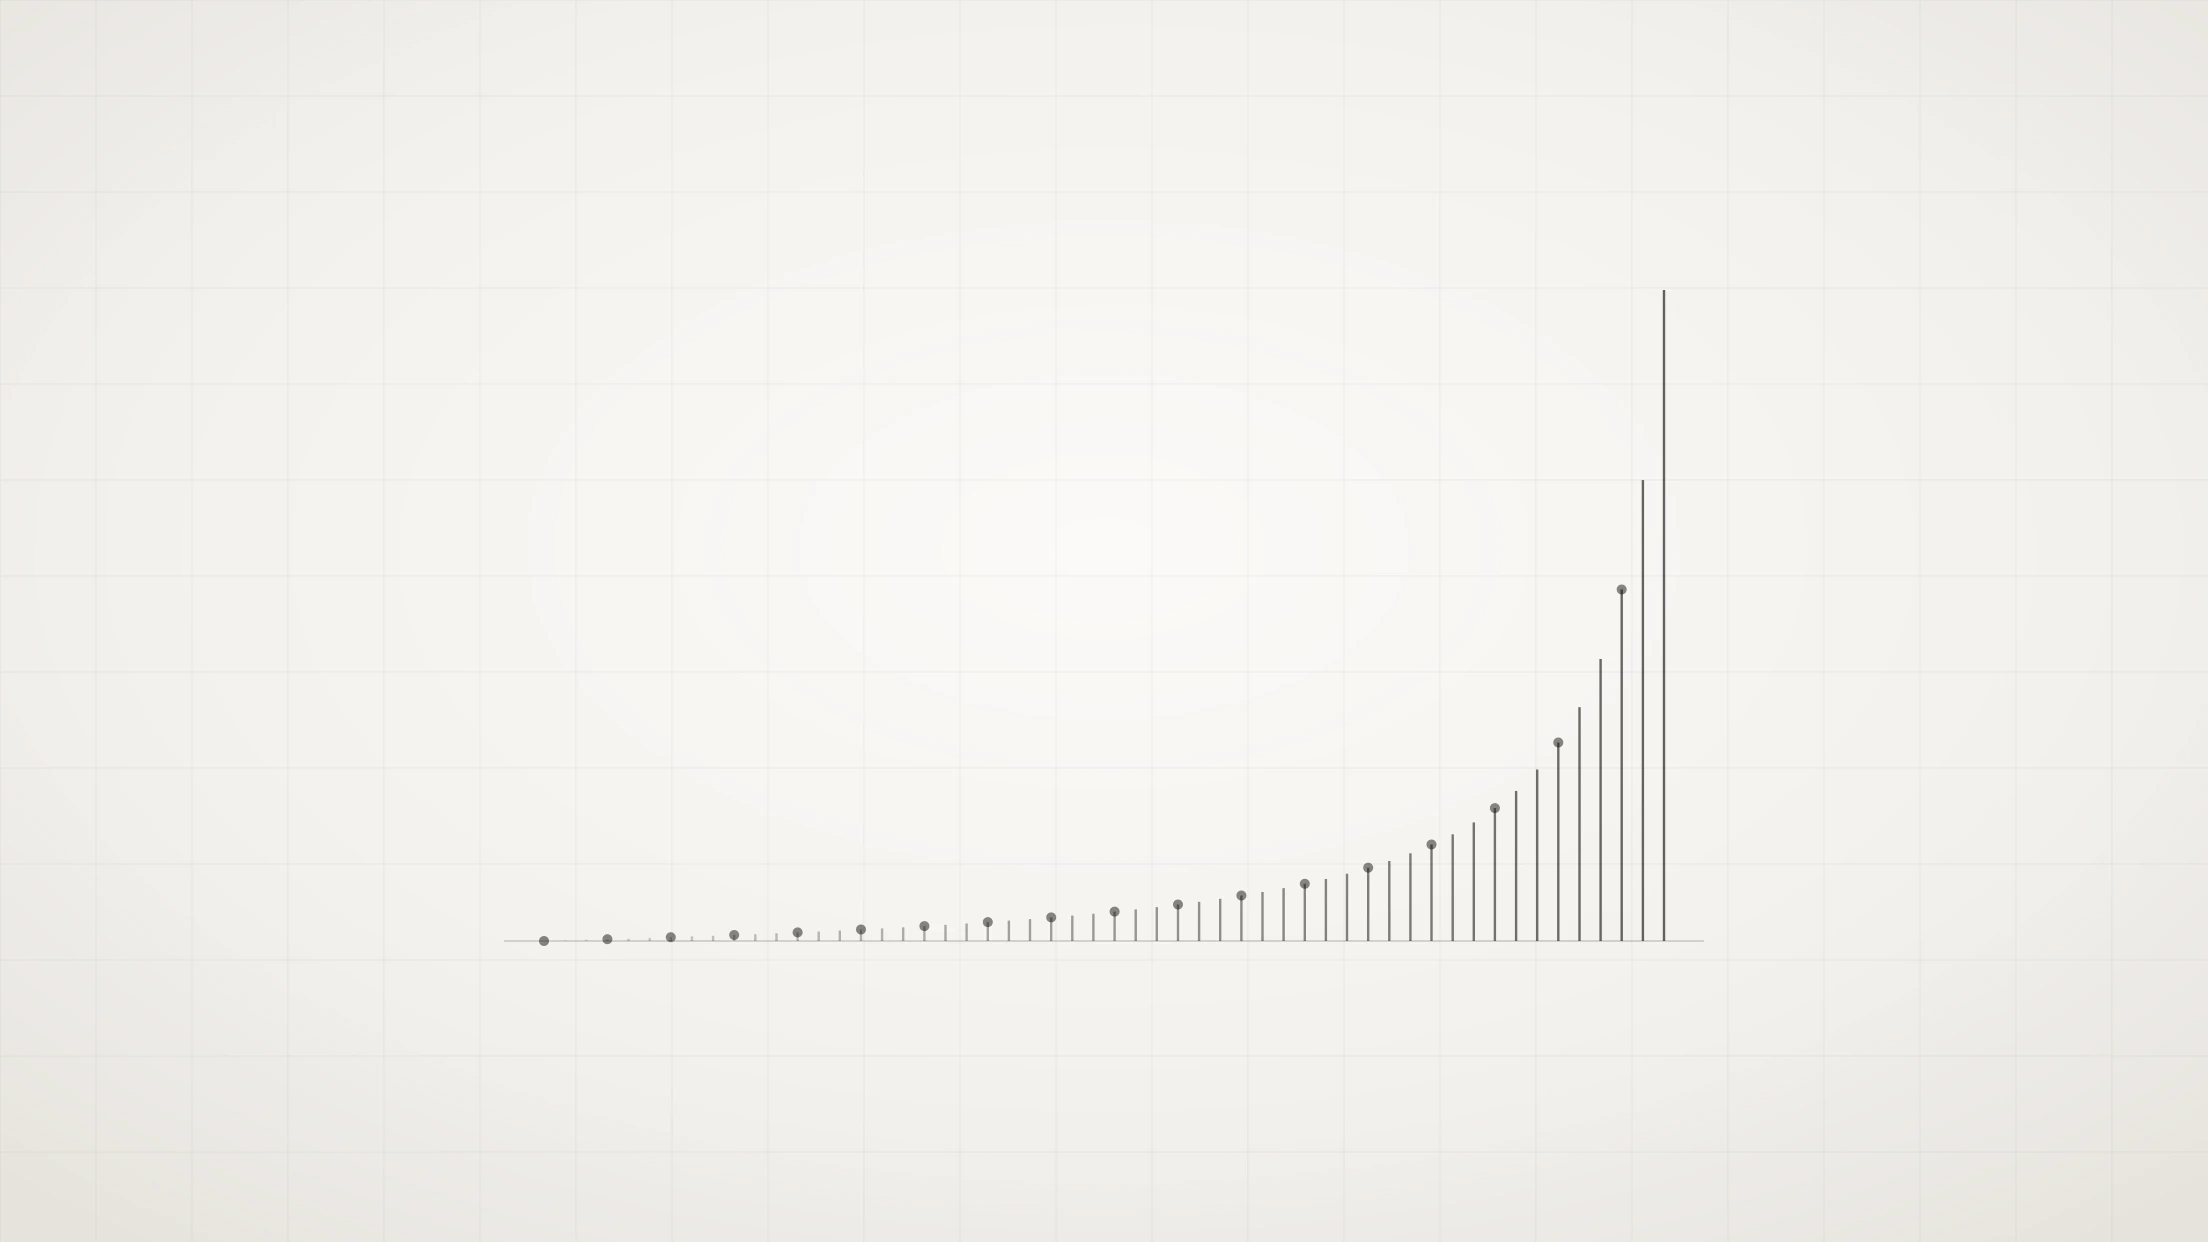
Take any resource that jobs arrive at randomly and that serves them one at a time. A designer, a reviewer, a QA lane, a database migration slot, the one engineer who understands billing. Call the fraction of its capacity that is already committed the utilisation. For the simplest model of such a queue, the average time a new job spends waiting, measured in multiples of how long the job itself takes, is utilisation divided by one minus utilisation.
At 50 percent booked, a job waits about as long as it takes to do. At 80 percent, four times. At 90 percent, nine times. At 95 percent, nineteen times.
Read the shape rather than the numbers, because the shape is the point. The curve is nearly flat, then it is a wall. The distance between a comfortable system and a jammed one is not a slow slide, it is a cliff you fall off between Tuesday and Thursday, usually without noticing that anything changed.
This is why the fully booked team feels so wrong to work with. Nothing is idle, everyone is busy, every hour is billable, and the smallest request takes three weeks. Nobody in that building is lazy. The system was designed, by accident, to be slow.
A team with no slack in it has not been optimised. It has been jammed.
The formula above assumes the simplest possible arrivals, and real queues are messier. Kingman's approximation, which is the honest version, adds a term for how variable arrivals and service times are, and variability only makes the wall arrive sooner. So the real curve is worse than the one drawn here, never better.
To go faster, carry less
The second piece of mathematics is even simpler and gets ignored even harder. Little's Law says the average time an item takes to get through a system equals the number of items in the system divided by the rate at which they come out.
Rearrange it and you get the only two levers there are. Finish faster, or carry less at once.
Every organisation reaches for the first. It is the one that sounds like ambition. The second is the one that works, because it is the one you actually control. Cut the number of things in flight and cycle time falls immediately, without anyone working differently, because the queue in front of each step got shorter.
This is why we cap what a pod carries rather than capping what a client can buy, and why "we will start it now and it will just take a while" is almost always a worse offer than "we will start it on the fourteenth and it will be done on the twenty first." The second one is not slower. It is the same amount of work, honestly sequenced, and it arrives sooner.
Where the calendar actually goes
Take a project with sixty decisions in it. Not epic decisions. Which endpoint, what happens on the error case, which of these two layouts, is this field required.
Suppose each one waits three days for an answer, because the person who can answer is in a different company, has a full calendar, and is copied on two hundred emails a day. Suppose four decisions can be open at once without blocking each other. Sixty decisions, three days each, four in parallel, is forty five calendar days of pure waiting, sitting inside a schedule that also has to contain the actual building.
Now suppose an answer takes four hours because a named person on the client side is in the same channel and has authority to decide. The same sixty decisions cost two and a half days.
The engineering did not change. The estimate did not change. The project got six weeks shorter because somebody was allowed to say yes.
We ask for that named person in every engagement, before the price is agreed, and we say plainly what happens if they are not there. It is the least glamorous term in our contracts and the one that moves dates the most.
The evidence, at industry scale
None of this is our theory. DORA has been surveying delivery performance across thousands of organisations for a decade, and the gap it measures between the top and bottom clusters is not the sort of gap that individual talent produces.
Elite performers ship changes in under a day and recover from a bad deploy in under an hour. The bottom cluster measures the same two things in months and in weeks. And the fast group is not paying for speed with quality, which is the part that offends people's intuition: their change failure rate is around 5 percent against roughly 40 percent at the bottom.
Fast and safe are the same property. They both come from small batches, short queues and quick feedback. Slow and dangerous are also the same property, and they both come from the opposite.
Taste is a compression algorithm
So far this is all queueing theory, which is speed without judgement. Judgement is the other half, and it is where the word taste earns its place.
Taste, stripped of the romance, is a set of priors strong enough that you can skip most of the search. A team with taste does not evaluate nine layouts. It knows, from having built the thing many times, that seven of them are wrong, tries the two that are not, and picks in an afternoon. That is a decision made in hours instead of weeks, and it is a better decision, not a worse one, because the seven that were skipped really were wrong.
This is why taste shows up as speed rather than as beauty. The beauty is a side effect. The primary effect is that a whole category of question stops needing a meeting.
Taste is also the only defence against the failure mode of everything written above. Cut queues and shorten decision loops and you get a team that can produce a large volume of mediocre choices very quickly. Speed with no judgement is just a faster way to arrive somewhere you did not want to be.
- ρ = 0.95
- booked capacity at which a queue's wait time is 19 times the work itself
- 1 in 4
- proportion of a schedule that is often decision waiting rather than work
- 5% vs 40%
- change failure rate, DORA's top cluster against its bottom
- 4 hours
- our target for a decision that has an owner
What this costs
Slack is expensive and it looks like waste on a spreadsheet. A team run at 75 percent capacity has a quarter of its hours unsold, and every finance conversation will point at that number. We hold it anyway because the alternative is the wall in the first figure, but it means our rate has to carry it, and we would rather explain that than quietly bill it as something else.
Small batches irritate people who want the whole thing scoped up front. Sequencing honestly means saying "not yet" to work we could technically start, which reads as unhelpful right up until the moment it reads as the reason everything landed on time.
And taste is opinionated by construction. A team that skips seven options without discussing them is a team that will occasionally skip the one you wanted. We would rather have that argument in week one than deliver nine mediocre options in week six.
The short version
Speed is not effort. It is queue length, batch size and decision latency, and all three are set by the way the engagement is structured, before a single line of code is written. Anybody can be busy. Being fast is a choice somebody made about the shape of the system, and you can hear whether they made it in the first ten minutes of a scoping call.
References
- Queueing result quoted is the mean waiting time of the M/M/1 queue, ρ/(1-ρ) in units of service time. The variability-aware version is Kingman's approximation, 1961
- John D. C. Little, A Proof for the Queuing Formula: L = λW, Operations Research, 1961
- DORA, Accelerate State of DevOps Report 2024, roughly 3,000 respondents, dora.dev
- Google Cloud, Announcing the 2024 DORA report, cloud.google.com